Chicago Real Estate Market Overview
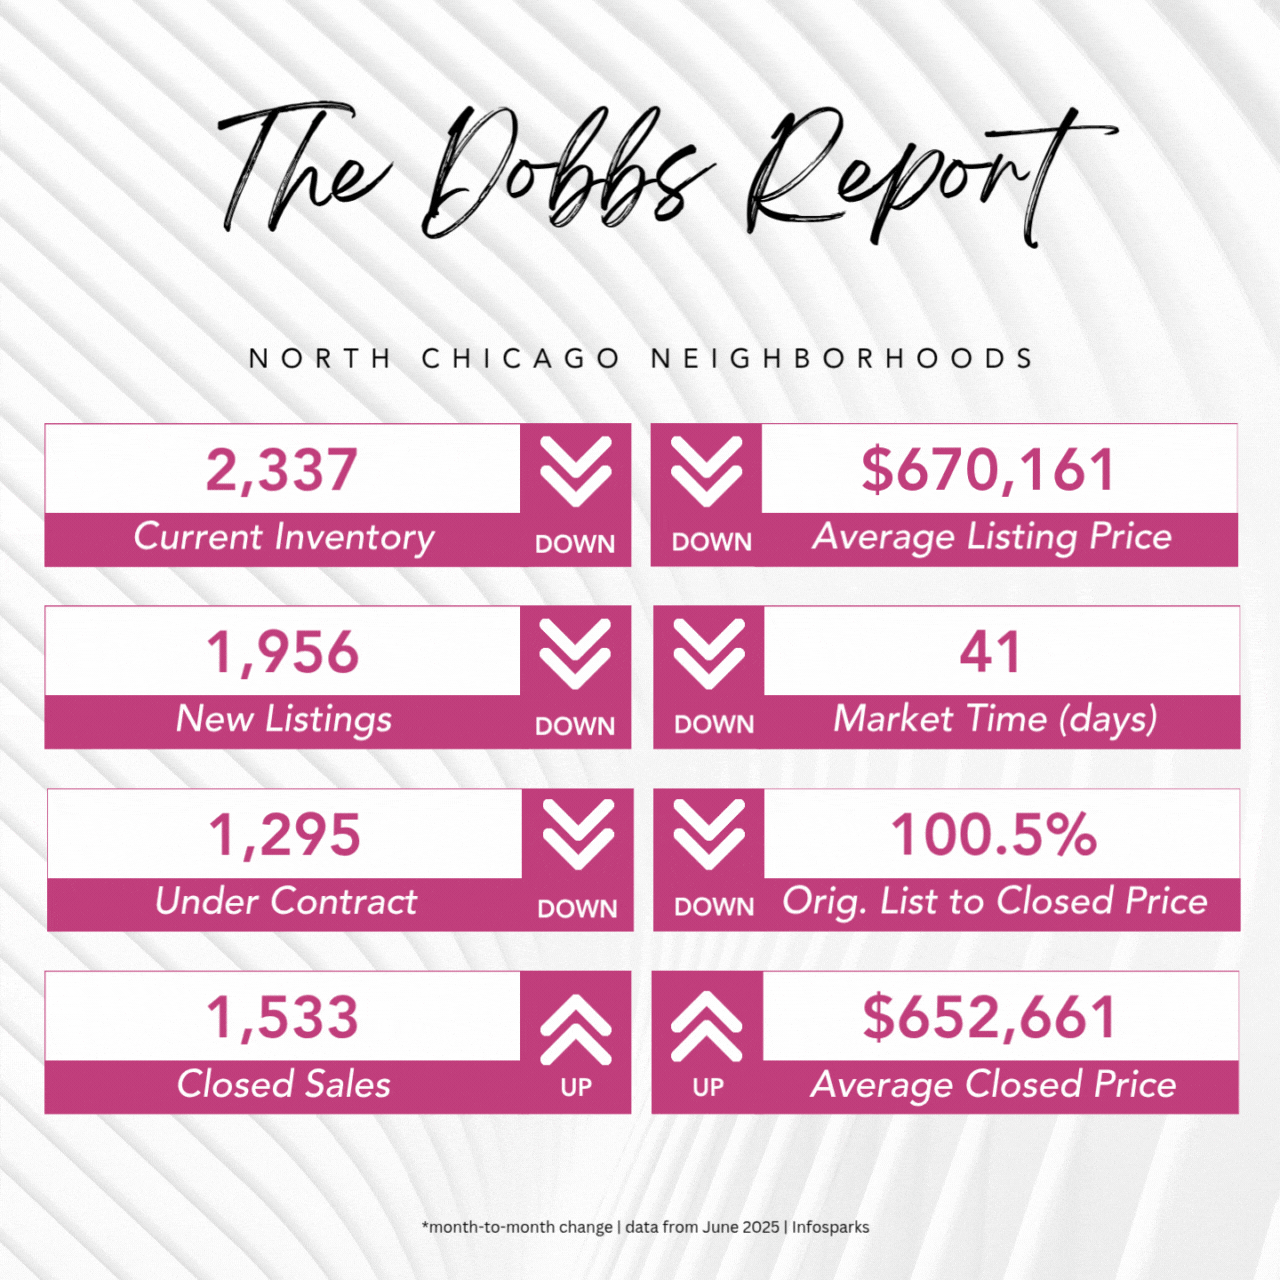
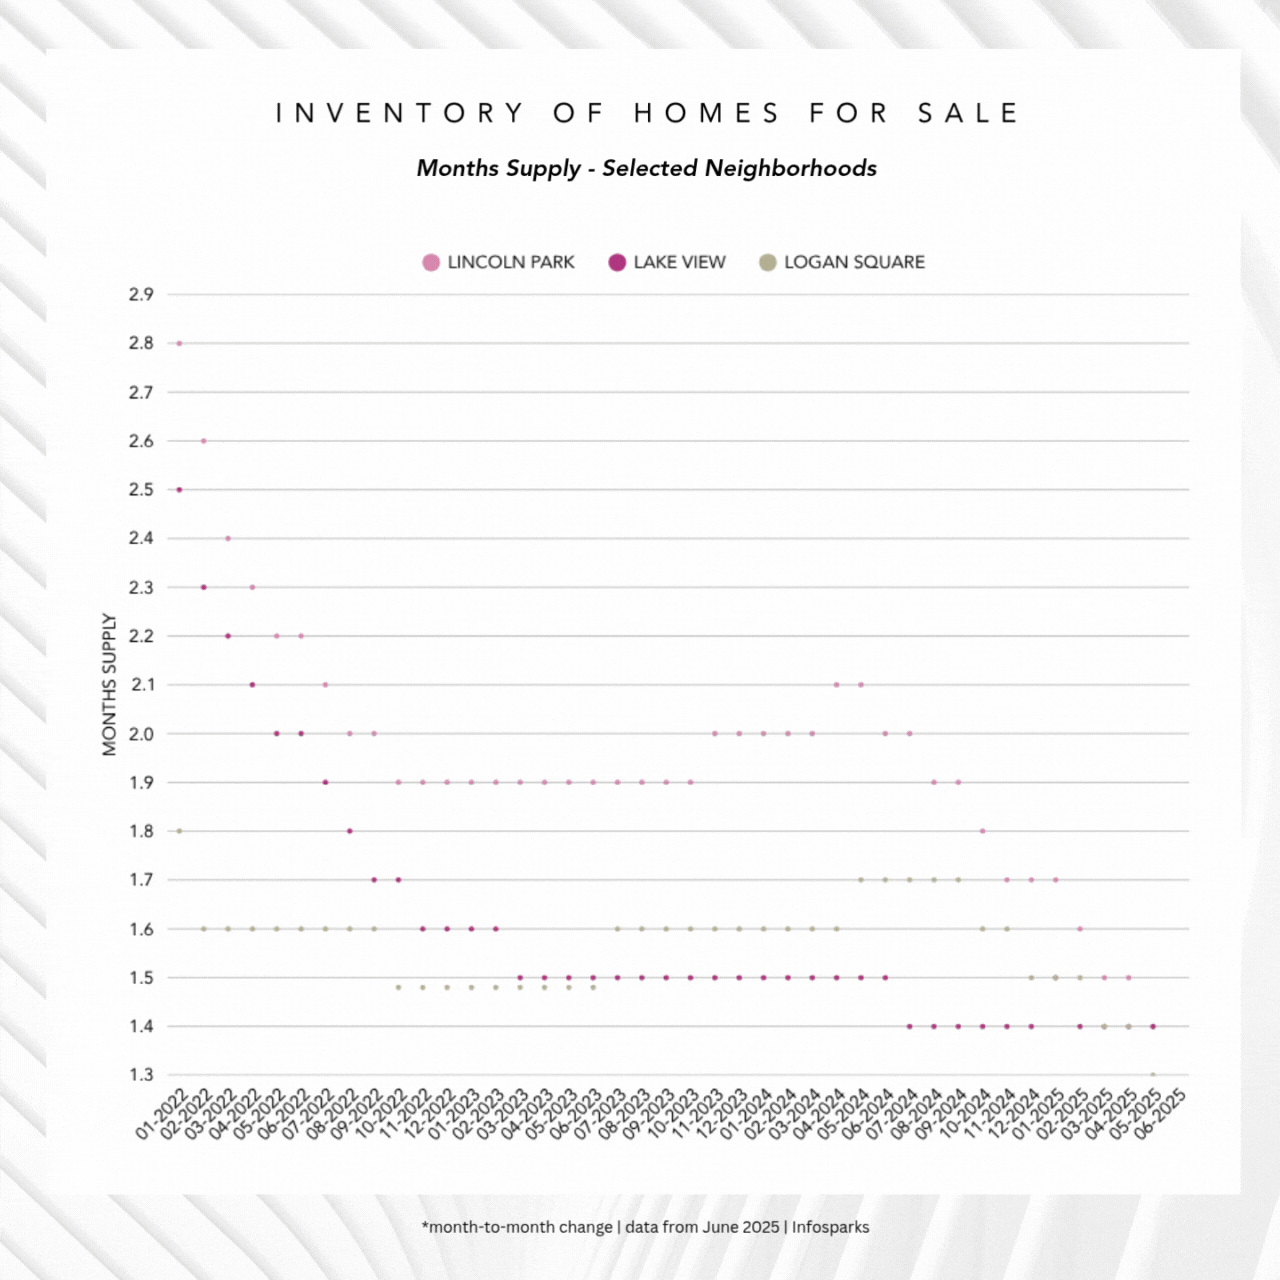
Chicago’s North Side market continued to tighten in June. Inventory fell to 2,337 active listings (down from 2,641 in May), and new listings dropped to 1,956, deepening the supply crunch. Despite fewer homes hitting the market, closed sales jumped to 1,533 (up from 1,435), and the average closed price rose to $652,661, while average listing price declined slightly to $670,161. Homes are moving faster, with market time down to 41 days, and sellers are still commanding strong offers, with a 100.5% sale-to-list ratio. While homes under contract declined to 1,295, overall demand remains high. At the neighborhood level, months of supply remains historically low—around 1.4 in Lake View, 1.4 in Logan Square, and 1.6 in Lincoln Park—reinforcing the competitive conditions across all three key markets.
Chicago Homes – Dynamic Market Overview
| City | Num Active Listings | Avg Listing Price | Avg Price Reduction | Avg Days on Market | Avg Price per SqFt |
|---|---|---|---|---|---|
| Chicago | 2,465 | $486,301 | -8.1% | 203 | $200 |
| 2,465 | $486,301 | -8.1% | 203 | $200 |
| City | Num Active Listings | Avg Listing Price | Avg Price Reduction | Avg Days on Market | Avg Price per SqFt |
|---|---|---|---|---|---|
| Chicago | 11,376 | $543,033 | -5.0% | 84 | $329 |
| 11,376 | $543,033 | -5.0% | 84 | $329 |
Dynamic searches of market trends will give you an overview of the real estate market's current state. Set your preferred parameters to find statistical data from recent real estate transactions in Chicago. For an in-depth analysis of a specific market segment, please contact me. I'll be happy to create a tailor-made analysis that perfectly suits your specific criteria.
Request a Custom Market Snapshot
Wondering what the numbers look like in your neighborhood? We’ll create a tailored report based on your location and your property type—condos, single-family homes, or across all residential categories.
Use the form below to request your custom stats and see what today’s market could mean for your home.
